
PREDICTIVE ANALYSIS USING R
Predictive analysis is a branch of analysis which uses statistics operations to analyse historical facts to make forecast future events. It is a common term used in data mining and machine learning. Methods like time series analysis, non-linear least square etc are used in predictive analysis. Predictive analytics can help many businesses as it treasures out the relationship between the various data points in data and the pattern is predicted. Thus, allowing businesses to create predictive intelligence.
Method of Predictive Analysis
Predictive analysis consists of 7 processes as follows:
• Define project: Defining the project, scope, importance, and result.
• Data collection: Data is collected through data mining providing a complete view of customer interactions.
• Data Analysis: It is the process of cleaning, inspecting, transforming, and modelling the data.
• Statistics: This process enables validating the assumptions and analysing the statistical models.
• Modelling: Predictive models are generated using statistics and the most optimized model is used for the deployment.
• Deployment: The predictive model is deployed to automate the production of everyday decision-making results.
• Model monitoring: Keep investigating the model to review performance which ensures expected results.
Requirement of Predictive Analysis
• Understanding customer behaviours: Predictive analysis uses data mining feature which extracts attributes and behaviour of customers. It also discovers out the interests of the customers so that business can learn to signify those products which can increase the probability or likelihood of buying.
• Competition in the market: With predictive analysis, businesses or companies can make their way to grow fast and stand out as a competition to other businesses by finding out their weakness and strengths.
• Learn new opportunities to increase revenue: Companies can create new offers or discounts based on the pattern of the customers providing an increase in revenue.
• Locate areas of weakening: Using these methods, companies can gain back their lost customers by finding out the past actions taken by the company which customers did not like.
Applications of Predictive Analysis
• Health care: Predictive analysis can be used to determine the history of patient and thus, determining the risks.
• Financial modelling: Financial modelling is another aspect where predictive analysis plays a major role in finding out the trending stocks helping the business in decision making process.
• Customer Relationship Management: Predictive analysis helps firms in creating marketing campaigns and customer services based on the analysis produced by the predictive algorithms.
• Risk Analysis: While forecasting the campaigns, predictive analysis can show an estimation of profit and helps in evaluating the risks too.
Example:
In prediction, there are different types of already existing models in RStudio like lm, glm or random forest. We will talk about "lm" here.
Predict function syntax in R looks like this: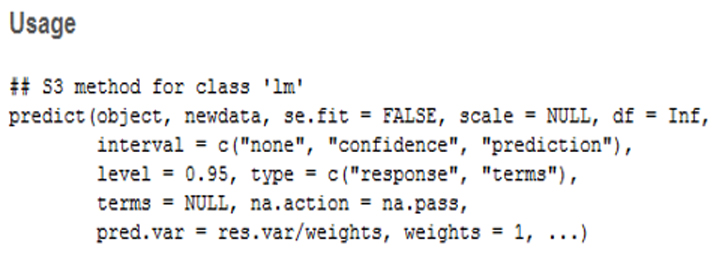
Arguments
• The object is a class inheriting from "lm".
• Newdata is a new data frame wherein we must predict the value.
• Se.fit is used when standard errors are required.
• The scale is generally NULL, but it is used for standard error calculation.
• Df is degrees of freedom.
• Interval, here we have mentioned the type of interval for the calculation.
• Level, here we must mention the confidence level which is fine to the researcher. Like some studies are conducted with 95% confidence and some are done on 99%.
• Type, basically the type of prediction (response or model)
• Na.action is a function which instructs what to do with missing values, the default here is NA.
• Pred.var is the variance for future observation which needs to be assumed for the prediction interval.
• Weights are the variance weights for prediction.
We will work on the dataset which already exists in R known as "Cars". And we will build a linear regression model that will predict the distance based on the speed.
This dataset has 50 observations of 2 variables.
• The first variable is speed (mph) which has numeric figures.
• The second variable is Distance (ft) which also has numeric figures.
Partial dataset "cars" look like this.
To build the linear regression model to predict something we need a model that has both input and output. Once the model learns that how data works, it will also try to provide predicted figures based on the input given.
Make a model.
linear_model = lm(dist~speed, data = cars)
linear_model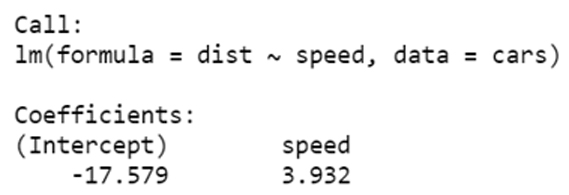
The Linear regression model equation is:
Y = β1 + β2X + ε
• X = Independent Variable
• Y = Dependent Variable
• β1 = Intercept of the regression model
• β2 = Slope of the regression model
• ε = error term
When we fit variables of our model then the equation looks like:
Dist = β1 + β2(Speed) + ε
And when we fit the outcome of our model into this equation it looks like:
Dist = -17.579 + 3.932(Speed)
Currently, we have a model, we can predict the value of the new dataset by giving inputs to our model.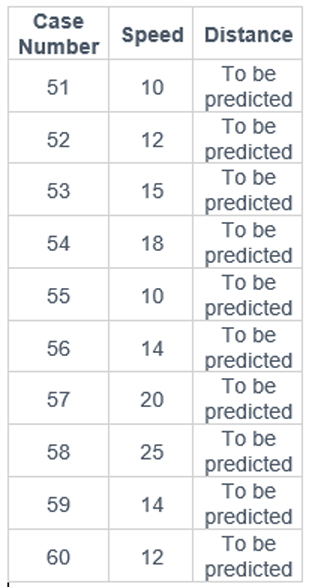
We will provide the above speed variable data as an input to our model.
We can predict the value by using function Predict() in Rstudio.
Example:
Input_variable_speed linear_model = lm(dist~speed, data = cars)
predict(linear_model, newdata = Input_variable_speed)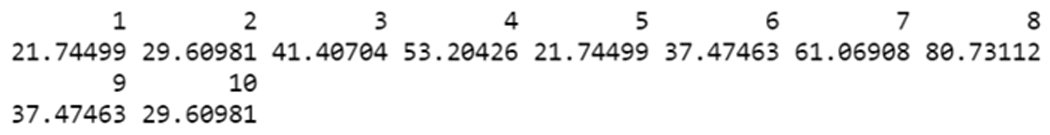
We have predicted values of the distance variable. We must include confidence level also in these predictions, this will help us to see how sure we are about our predicted values.
Output with predicted values.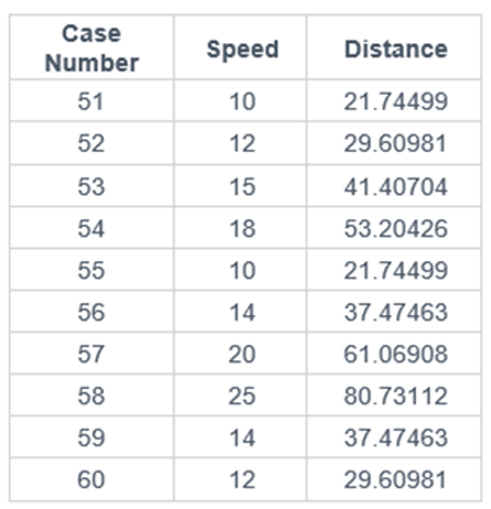
Confidence interval of Predict Function in R
It will help us to deal with the uncertainty around the mean predictions. By using interval command in Predict() function
we can get 95% of the confidence interval. This 95% of confidence level is pre-fitted in the function.
Example
Input_variable_speed linear_model = lm(dist~speed, data = cars)
predict(linear_model, newdata = Input_variable_speed, interval = "confidence")
Output: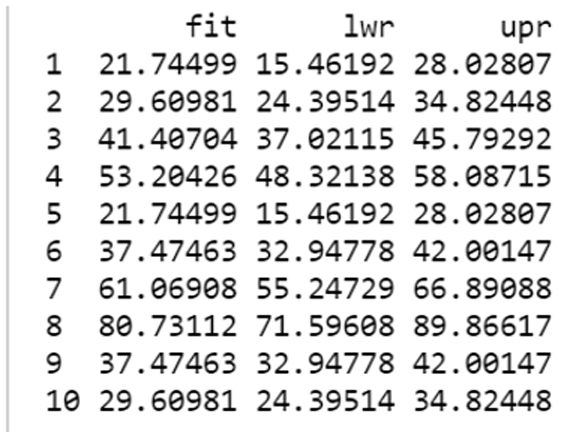
The 95% confidence intervals associated with a speed of 10 are (15.46, 28.02).
This means that, according to our model, 95% of the cars with a speed of 10 mph have a stopping distance between 15.46 and 28.02.
About Rang Technologies:
Headquartered in New Jersey, Rang Technologies has dedicated over a decade delivering innovative solutions and best talent to help businesses get the most out of the latest technologies in their digital transformation journey. Read More...