
BINOMIAL ENDPOINTS IN CLINICAL TRIAL AND GETTING 95% CONFIDENCE INTERVAL
There are various types of endpoints designed to get meaningful conclusion in clinical trial. These endpoints can be
- Continuous E.g. Change from baseline in blood sugar after 6 month of treatment
- Binary - E.g. Response or no response
- Time to event - E.g. Time to progression of tumor, time to hospitalization
- Counts - E.g. Frequency of occurrence of AE
Today, we'll talk about binary endpoints in clinical trial.
As name says, binary, there are 2 possible outcomes. E.g. response vs. no response, occurrence vs. no occurrence. Let's take example to understand this. In clinical trial, if response is defined as "falling of blood pressure below 150mmHg after 6 month of 1st dose of treatment" then blood pressure would be observed for each subject after 6 month of treatment. There can be various values at that visit for each subject (as shown in example 1). However, the value on that visit (6 month after 1st dose of treatment) may fall below 150mmHg or may not. So, it can be categorized into YES or NO as response (as shown in response1). If yes, then it would be called, "Responder" and if no, it would be called "Non-Responder".Similarly, in viral diseases (like hepatitis), this binary endpoint can be presence/absence of virus in blood of subject after follow-up week 12. This type of response can be defined for almost for all kind of data.
Now, what if we change the way response is defined? Let's say, response is define as "falling of blood pressure below 135mmHg after 6 month of 1st dose of treatment" (Suppose, reviewers are interested in both definition of response). Then, look at the response 2 column of table. Here, some of the subjects (like TT129, TT30) are non-responder as per definition of response2 (below 135mmHg) compared to response1 (below 150mmHg). So, it is important to understand "How the response is defined?"
As shown above, many times in clinical trial, there are multiple definitions of response to do analysis of data in various ways; however, one of them would be primary endpoint.
How to do analysis of binary data?
If you come across data similar to described above, you would probably see following types of analysis in summary tables.
Frequency: Counting of number of subject responder out of population of analysis.
E.g. For Response 1: Responder/population 5/8
For Response 2: Responder/population 3/8
Percentages: Calculating percentage of responder out of population of analysis.
E.g. For Response 1: %Responder 62.5
For Response 2: %Responder 37.5
95% Confidence Interval (CI): Calculating 95% Confidence Interval (CI) for proportion (i.e. responder/population). There are various CI, however, EXACT CI is more widely used in clinical trial.
E.g. For Response 1: Lower Limit of 95% 24.49
Upper Limit of 95% 91.48
For Response 2: Lower Limit of 95% 08.52
Upper Limit of 95% 75.51
Let's see how to calculate each statistics for binary data to create table.
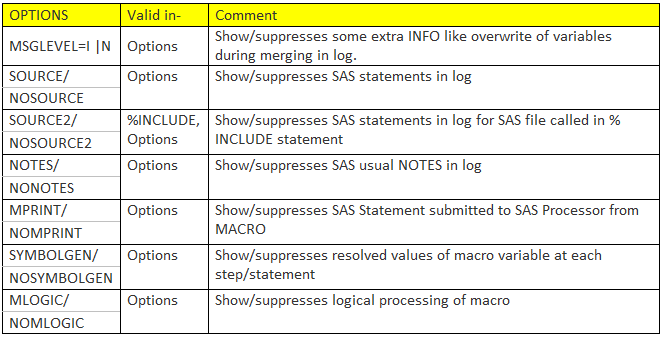
Frequency: Can be calculated using PROC FREQ, PROC MEANS, PROC SUMMARY etc. using 'CLASS' or 'BY' statements.
Percentage: It is calculated by default in PROC FREQ; however, since it is calculated based on class frequency, it may not be always correct, so it needs to be checked..
Better way to calculate it would be data step.
95% CI of proportion: This is very tricky but easy to calculate in SAS using PROC FREQ. There are many papers on how to correctly calculate the 95% CI around the proportion.
Calculation of CI using PROC FREQ:
proc freq data=test ;
tables Response / binomial alpha=.05;
EXACT binomial;
ODS OUTPUT binomialprop=bin(where=(name1 in ('XL_BIN', 'XU_BIN')));
RUN;
Things to remember when using PROC FREQ for 95% CI:
Challenge 1.Coding of response variable:
It calculates 95% CI for lower level of response variable. For example, Response variable has 2 possible values: 1- Response and 0- No response, then PROC FREQ would calculate it for lowest level i.e. 0 (No Response) by default. So, for response 1, PROC FREQ would calculate it for 0 (No) i.e. proportion 3/8 (8.52, 75.51). Be careful! Don't use this CI for response.
Solution:
a. Programmatically, change the level in such a way that response level is lowest (re-coding response). E.g. put condition like - if response = 0 then response=2; There are many other way to do the same.
b. Use LEVEL= option in TABLE statement along with binomial.
table response / binomial (level=2);
Challenge 2.Absence of any one of level data
If there is only 1 level in specific BY GROUP in input dataset, then PROC FREQ calculates 95% CI for that level. E.g. Example 2 and Treatment B group in example 3 has only one level of response.
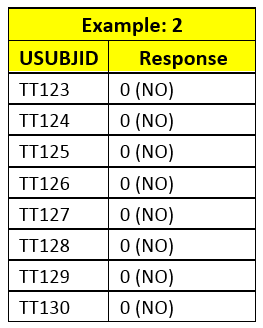
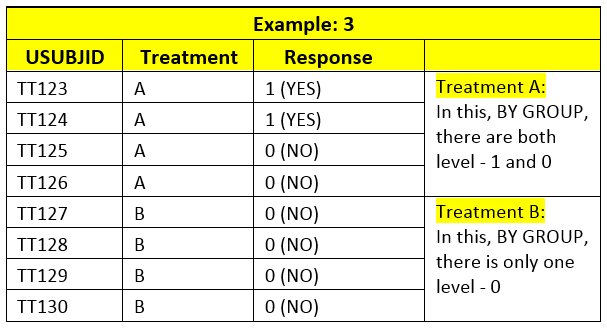
If in input data, there is any BY GROUP with only 1 level of non-responder, 0, PROC FREQ would calculate 95% CI for non-responder; even if you change Level or recode the response.
Solution: Briefly, you have to create dummy dataset with all level for all BY GROUP with weight variable value 0. And, then insert it in main dataset such a way that only missing by groups are inserted into main dataset with weight variable 0 (variable weight should have value 0 for records coming from dummy dataset). Then, use WEIGHT statement in PROC FREQ with weight variable. (For more detailed steps please read: http://www.pharmasug.org/proceedings/2014/IB/PharmaSUG-2014-IB05.pdf Page 5, Method 3. We'll try to discuss this in separate blog, if needed)
However, when it is frequent to calculate, it requires a more programming and it is prone to error (if not understood correctly how PROC FREQ calculates 95% CI).
So, I personally, suggest using data step to calculate 95% CI for binomial proportion for beginners.
You can use this macro as per your requirement and customize it as per your need. The following partial code is the key for calculating 95% CI in DATA step. It can be use as per need and macrotized for more convenience.
*x is no. of success;
*n is no. of binomial trial or total;
p=(x/n);
if p=0 then CI_LOW=0;
if p=1 then CI_HIGH=1;
if p ne 0 then CI_LOW=((1-betainv(.975,(n-x+1),x));
if p ne 1 then CI_HIGH=((1-betainv(.025,(n-x),x+1));
*EXACT MACRO;
/*---------------------------------------------------------------------
Exact Macro:
* Use: Calculate 95% CI for Binomial
* Parameters:
#ds : Name of input Dataset to pass
#x : Name of variable for Success (Numerator part) E.g. 5/8. So, variable holding value of 5 success.
#n : Name of variable for total (Denominator part) E.g. 5/8. So, variable holding value of 8 total.
#Out: Any number to create unique output dataset (with 95% CI). E.g. out=1 would create dataset CI_1
---------------------------------------------------------------------*/
%Macro exact (ds=,x=,n=, out=);
dataci_&out;
set&ds;
if&x=0 and &n=0 then do;
CI_LOW=0;
CI_HIGH=1;
Put "There is N=0 and X=0 in data." ;
End;
else if &n ne 0 then do;
p=round ((&x/&n),.0001);
if p=0 then CI_LOW=0;
if p=1 then CI_HIGH=1;
if p ne 0 then CI_LOW=round((1-betainv(.975,(&n-&x+1),&x)),.0001);
if p ne 1 then CI_HIGH=round((1-betainv(.025,(&n-&x),&x+1)),.0001);
end;
format CI_LOW CI_HIGH p 8.4 ;
run;
%Mend;
Finally, to quick check for your values of 95% CI, see for range (Lower and Upper CI limits) includes the proportion.
E.g. For 0/10, proportion is 0.0. So, its 95% CI cannot be (69.15, 1). But, it can be (0, 30.85).
Hope it helps you and please let me know if you have any questions on this.
Snapshot of dummy table with proportion and binomial 95% CI
References:
Nair, Indu, and Binal Patel. "Attain 100% Confidence in Your 95% Confidence Interval." PharmaSUG IB05 (2014): n. pag. Web. 5 Dec. 2015.
Abraham, Jose. "Computation of CIs for Binomial Proportions in SAS Clinical and Its Practical Difficulties." PhUSE SP05 (2013): n. pag. Web. 5 Dec. 2015.
About Rang Technologies:
Headquartered in New Jersey, Rang Technologies has dedicated over a decade delivering innovative solutions and best talent to help businesses get the most out of the latest technologies in their digital transformation journey. Read More...